Table of Contents
Introduction
Small business owners face a familiar dilemma: you know customer relationship management (CRM) software would help organize contacts, track sales, and manage follow-ups, but dedicated CRM platforms cost $50-$150 per user monthly. For a five-person team, that’s $3,000-$9,000 annually a significant expense when you’re watching every dollar. Meanwhile, Microsoft Excel sits on your computer, already paid for, with capabilities most users barely scratch the surface of.
The hesitation to rely on Excel for business-critical functions often stems from uncertainty about legitimacy and capabilities. Users wonder: is using Excel instead of a CRM professional enough? Will I miss critical features? And if I need to purchase or upgrade to Microsoft Excel 2024 for enhanced functionality, how do I ensure I’m getting genuine software that won’t fail when my business depends on it?
These concerns are valid. Excel isn’t marketed as CRM software, so many business owners don’t realize it already contains powerful features that duplicate core CRM functionality contact databases, sales pipeline tracking, automated calculations, visual dashboards, and task management. When properly configured, Excel transforms from a simple spreadsheet tool into a sophisticated business management system that costs a fraction of dedicated CRM subscriptions.
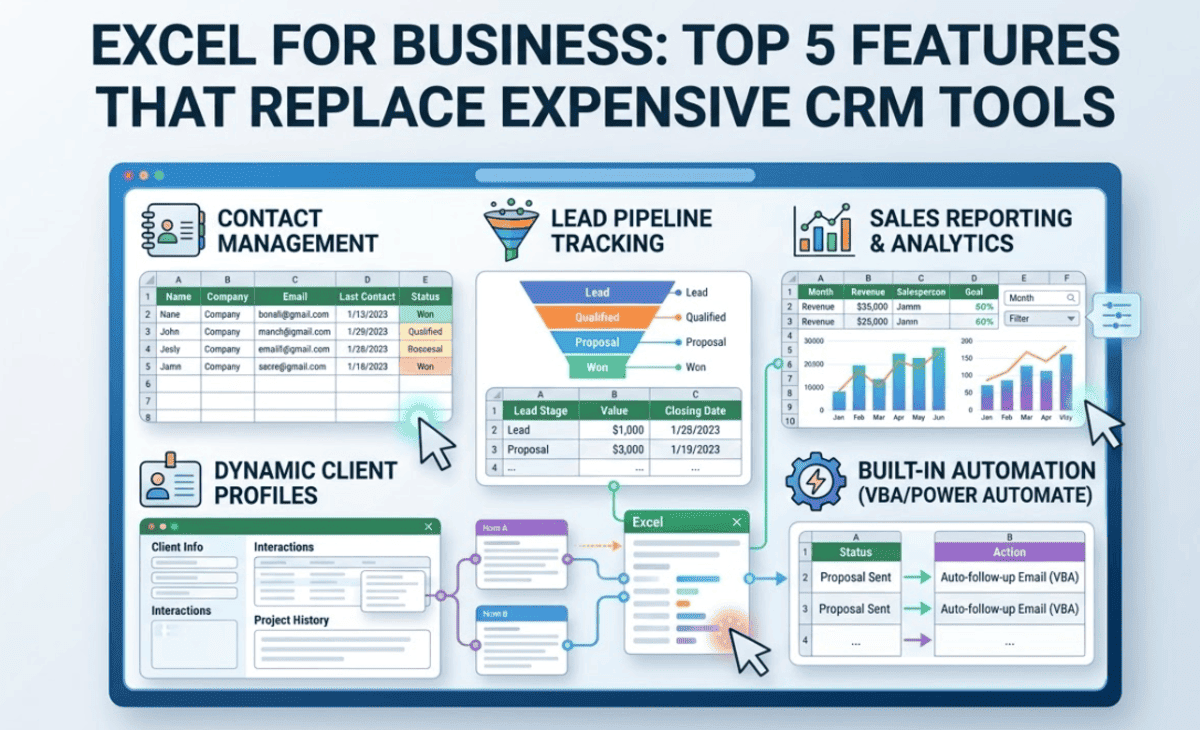
This guide reveals the five Excel features that genuinely replace expensive CRM tools for small businesses. You’ll learn exactly how to build contact management systems, track sales pipelines visually, automate forecasting calculations, create professional business dashboards, and manage tasks and follow-ups all within Microsoft Excel 2024. Whether you’re currently using Excel and want to maximize its business potential, or considering whether to buy Microsoft Excel 2024 as a cost-effective CRM alternative, this comprehensive overview demonstrates Excel’s surprising power for small business customer relationship management.
Why Businesses Still Use Excel as a CRM
Despite the proliferation of specialized CRM platforms, countless small businesses continue choosing Excel for customer relationship management and for good reasons beyond just cost savings.
The Universal Familiarity Factor
Excel’s Learning Curve Advantage:
Unlike proprietary CRM systems requiring extensive training, most business professionals already understand Excel basics. This familiarity dramatically reduces:
- Implementation time (days vs. months)
- Training costs (minimal vs. thousands in consulting)
- Employee resistance (using familiar tools vs. learning new platforms)
- Productivity loss during transition periods
Real-World Scenario: A five-person consulting firm can build a functional Excel CRM in an afternoon using existing skills, versus spending weeks learning Salesforce, HubSpot, or similar platforms.
Total Cost of Ownership
Excel’s Financial Advantages:
One-Time Purchase Model:
- Microsoft Excel 2024 (standalone): ~$159.99 (perpetual licence)
- Office 2024 Home & Business: ~$229.99 (includes Word, PowerPoint, Outlook, Excel)
- No monthly subscription fees
- No per-user licensing multipliers
- No forced upgrades
Dedicated CRM Subscription Costs:
- Basic CRM: $25-$50 per user/month
- Professional CRM: $75-$150 per user/month
- 5 users over 3 years: $4,500-$27,000
- Additional costs for integrations, storage, support
Break-Even Analysis: Even buying Microsoft Excel 2024 for every employee costs less than 2-3 months of CRM subscriptions.
Flexibility and Customization
Excel’s Adaptability:
CRM platforms impose rigid structures fields, workflows, and reporting formats designed for broad markets, not your specific business. Excel offers:
- Complete customization of data structure
- Custom formulas matching your exact business logic
- Layouts designed around your workflow
- No vendor lock-in or proprietary data formats
Data Control and Privacy
Excel’s Security Advantages:
With Excel-based CRM systems:
- Data stays on your servers or trusted cloud storage (OneDrive, SharePoint)
- No third-party access to customer information
- Compliance with data protection regulations easier to demonstrate
- No vendor access for “improving their platform”
When Excel Makes Business Sense
Excel works exceptionally well as a CRM alternative for:
- Businesses with 1-20 employees
- Sales processes with 5-50 active opportunities at once
- B2B companies with smaller customer bases (not thousands of contacts)
- Service businesses with straightforward sales cycles
- Teams already comfortable with Excel
- Businesses requiring custom fields and calculations
- Organizations with limited budgets
Feature #1: Contact & Lead Management
Excel’s database capabilities rival dedicated CRM contact management for small business needs.
Building a Structured Contact Database
Core Contact Information Fields:
Create a comprehensive contact table with these columns:
Essential Fields:
- Contact ID (unique identifier)
- First Name / Last Name
- Company Name
- Job Title
- Email Address
- Phone Number
- Address (Street, City, State, ZIP)
Business Relationship Fields:
- Lead Source (how you met them)
- Status (Lead, Prospect, Customer, Inactive)
- Industry/Sector
- Company Size
- Assigned Salesperson
Engagement Tracking:
- First Contact Date
- Last Contact Date
- Next Follow-up Date
- Notes/Comments
Using Excel Tables for Dynamic Data
Convert Your Range to an Excel Table:
- Select your contact data range
- Press Ctrl + T (or Insert > Table)
- Check “My table has headers”
- Click OK
Benefits of Excel Tables:
- Automatic formatting
- Filter buttons on every column
- Easy sorting and filtering
- Formulas auto-fill to new rows
- Structured references in formulas
Advanced Contact Management Features
Data Validation for Consistency:
Ensure data quality with dropdown lists:
- Select the “Status” column
- Data tab > Data Validation
- Allow: List
- Source:
Lead, Prospect, Customer, Inactive - Click OK
Now users can only select predefined statuses, preventing inconsistent entries like “lead,” “LEAD,” or “potential customer.”
Conditional Formatting for Visual Priorities:
Highlight important contacts automatically:
- Select “Last Contact Date” column
- Home > Conditional Formatting > Highlight Cells Rules > Less Than
- Enter:
=TODAY()-30(highlights contacts not reached in 30 days) - Choose formatting (red fill)
Quick Filtering and Search:
Excel’s filter functionality rivals CRM search:
- Click filter arrow on any column header
- Type search term in search box
- Select specific criteria (e.g., only “Prospect” status)
- Combine multiple filters across columns
Example Use Case: Find all prospects in the “Technology” industry assigned to “Sarah” who haven’t been contacted in 14+ days accomplished in seconds with column filters.
Contact Segmentation
Creating Named Ranges for Segments:
Define customer segments for easy reference:
- Filter table to specific segment (e.g., “Technology Industry Prospects”)
- Select filtered data
- Formulas tab > Define Name
- Name: “TechProspects”
- Click OK
Now formulas can reference TechProspects instead of complex cell ranges.
Feature #2: Sales Pipeline Tracking
Visualizing your sales pipeline in Excel provides clarity dedicated CRM tools charge premium prices for.
Building a Sales Opportunity Tracker
Pipeline Tracker Structure:
Create a second table tracking sales opportunities:
Opportunity Fields:
- Opportunity ID
- Contact Name (linked to contacts table)
- Company Name
- Opportunity Description
- Value/Deal Size
- Probability (%)
- Stage (Prospecting, Qualification, Proposal, Negotiation, Closed-Won, Closed-Lost)
- Expected Close Date
- Actual Close Date
- Assigned Salesperson
Visual Pipeline with Conditional Formatting
Color-Coding by Stage:
- Select “Stage” column
- Home > Conditional Formatting > New Rule
- Use a formula:
=$F2="Prospecting" - Format: Light blue fill
- Repeat for each stage with different colors:
- Qualification: Yellow
- Proposal: Orange
- Negotiation: Light green
- Closed-Won: Dark green
- Closed-Lost: Red
Result: Instantly see pipeline health by color distribution.
Weighted Pipeline Calculations
Calculating Expected Revenue:
Add a “Weighted Value” column with formula:
excel
=[@Value] * [@Probability]This multiplies deal size by probability, giving realistic revenue forecasts.
Total Pipeline Value:
excel
=SUMIF([Stage],"<>Closed-Lost",[Weighted Value])Shows total expected revenue from active opportunities.
Pipeline Aging Analysis
Days in Current Stage:
Add column with formula:
excel
=TODAY()-[@Stage_Entry_Date]Conditional Formatting for Stalled Deals:
Highlight opportunities in same stage 30+ days:
- Select “Days in Stage” column
- Conditional Formatting > Greater Than > 30
- Format: Red fill
Identifies deals needing attention.
Pipeline Dashboard with Pivot Tables
Creating Pipeline Summary:
- Select opportunity table
- Insert > PivotTable
- Drag “Stage” to Rows
- Drag “Value” to Values (set to SUM)
- Drag “Opportunity ID” to Values (set to COUNT)
Result: Instant summary showing:
- Number of opportunities per stage
- Total value per stage
- Average deal size per stage
Visual Representation:
Insert > PivotChart > Column Chart for visual pipeline.
Feature #3: Automated Calculations & Forecasting
Excel’s formula capabilities automate calculations that basic CRM tools require manual entry for.
Revenue Forecasting Formulas
Monthly Revenue Projection:
excel
=SUMIFS([Weighted Value],[Expected Close Date],">="&DATE(2024,3,1),[Expected Close Date],"<"&DATE(2024,4,1))Sums weighted pipeline value for opportunities expected to close in March 2024.
Quarterly Forecast:
excel
=SUMIFS([Weighted Value],[Expected Close Date],">="&DATE(2024,1,1),[Expected Close Date],"<"&DATE(2024,4,1))Win Rate Analysis
Calculating Actual Win Rate:
excel
=COUNTIFS([Stage],"Closed-Won")/COUNTIFS([Stage],"Closed-*")Divides won opportunities by total closed (won + lost).
Average Deal Size by Stage:
excel
=AVERAGEIF([Stage],"Proposal",[Value])Shows average value of opportunities in proposal stage.
Sales Performance Tracking
Salesperson Performance Table:
| Salesperson | Opportunities | Won | Lost | Win Rate | Total Revenue | Avg Deal Size |
|---|---|---|---|---|---|---|
| Sarah | =COUNTIF([Assigned],”Sarah”) | =COUNTIFS([Assigned],”Sarah”,[Stage],”Closed-Won”) | =COUNTIFS([Assigned],”Sarah”,[Stage],”Closed-Lost”) | =Won/Lost | =SUMIFS([Value],[Assigned],”Sarah”,[Stage],”Closed-Won”) | =Revenue/Won |
Dynamic Updates: All formulas automatically recalculate when new data is entered.
Trend Analysis with Moving Averages
3-Month Moving Average Revenue:
excel
=AVERAGE(OFFSET([Revenue],ROWS([Revenue])-3,0,3,1))Smooths revenue fluctuations to identify trends.
Feature #4: Reporting & Business Dashboards
Excel’s visualization tools create executive-ready dashboards rivaling expensive CRM reporting modules.
Creating an Executive Dashboard
Dashboard Components:
Key Performance Indicators (KPIs):
- Total Pipeline Value
- Number of Active Opportunities
- Average Deal Size
- Win Rate %
- Revenue This Month/Quarter/Year
Chart Elements:
- Pipeline by Stage (Column Chart)
- Revenue Trend (Line Chart)
- Win/Loss Distribution (Pie Chart)
- Opportunities by Salesperson (Bar Chart)
- Monthly Revenue Forecast (Area Chart)
Building Interactive Dashboards
Using Slicers for Filtering:
- Select your PivotTable
- PivotTable Analyze > Insert Slicer
- Choose fields: Salesperson, Stage, Industry
- Click OK
Result: Click slicer buttons to instantly filter all connected charts and tables.
Professional Formatting
Dashboard Layout Best Practices:
- Use consistent color scheme (company brand colors)
- Arrange KPIs at top for quick scanning
- Place most important charts in top-left (natural eye path)
- Use white space to prevent clutter
- Add company logo and report date
Conditional Icons for KPIs:
- Select KPI cell (e.g., Win Rate)
- Home > Conditional Formatting > Icon Sets > 3 Arrows
- Manage Rules > Edit Rule
- Set thresholds:
- Green arrow: >=30%
- Yellow arrow: >=20%
- Red arrow: <20%
Automated Dashboard Updates
Linking Dashboard to Data Tables:
Use formulas referencing your data tables:
excel
Total Pipeline: =SUM([Weighted Value])
Active Opps: =COUNTIF([Stage],"<>Closed-*")
Win Rate: =COUNTIFS([Stage],"Closed-Won")/COUNTIFS([Stage],"Closed-*")
Result: Dashboard updates automatically when data changes no manual refresh needed.
Feature #5: Task & Follow-up Management
Excel’s organizational features manage tasks and follow-ups as effectively as CRM activity trackers.
Building a Task Management System
Task Tracker Table:
Task Fields:
- Task ID
- Related Contact/Company
- Task Type (Call, Email, Meeting, Proposal, Follow-up)
- Description
- Assigned To
- Due Date
- Priority (High, Medium, Low)
- Status (Not Started, In Progress, Completed)
- Completion Date
- Notes
Automated Task Reminders
Overdue Task Highlighting:
- Select “Due Date” column
- Conditional Formatting > New Rule > Formula:
excel
=AND($H2"Completed") - Format: Red fill, bold text
Upcoming Tasks (Due Within 3 Days):
Formula:
excel
=AND($H2<=TODAY()+3,$H2>=TODAY(),$I2<>"Completed")Format: Yellow fill
Task Distribution by Team Member
Personal Task Lists:
- Filter task table by “Assigned To” = Current User
- Further filter by “Status” <> “Completed”
- Sort by “Due Date” ascending
Result: Each team member sees only their pending tasks, sorted by deadline.
Follow-up Automation
Next Follow-up Field in Contacts:
Link tasks to contacts:
excel
=MINIFS([Due Date],[Related Contact],[@Contact Name],[Status],"<>Completed")Shows next scheduled task for each contact.
Follow-up Alert Formula:
excel
=IF([@Next Followup]Limitations of Using Excel as a CRM
While Excel offers impressive CRM functionality, honest assessment requires acknowledging its limitations.
Scalability Constraints
When Excel Struggles:
- Contact volume: Beyond 5,000-10,000 contacts, performance degrades
- Concurrent users: Multiple people editing simultaneously causes conflicts
- Complex automation: Advanced workflows require VBA programming
- Mobile access: Limited compared to dedicated CRM mobile apps
Collaboration Challenges
Multi-User Issues:
- File locking when one person edits
- Version control complications
- Merge conflicts with simultaneous changes
- Difficult audit trails for who changed what
Partial Solution: SharePoint or OneDrive with co-authoring features in Microsoft Excel 2024 improves collaboration but doesn’t match dedicated CRM real-time sync.
Missing Advanced Features
What Excel Lacks:
- Email integration: No native email tracking or logging
- Marketing automation: No email campaigns or nurture sequences
- Advanced reporting: Limited compared to enterprise CRM analytics
- Third-party integrations: No app marketplace like Salesforce
- AI-powered insights: No predictive analytics or lead scoring
Data Integrity Risks
Potential Problems:
- No mandatory field validation (unless manually configured)
- Accidental deletions without proper backups
- Formula errors from improper editing
- Inconsistent data entry formats
Mitigation: Implement strict data entry procedures, regular backups, and protect critical formulas.
Who Should Use Excel Instead of a CRM
Excel-based CRM works best for specific business profiles.
Ideal Excel CRM Users
Small Businesses (1-15 Employees):
- Limited budget for software subscriptions
- Straightforward sales processes
- Existing Excel expertise
- Customer base under 1,000 active contacts
Service-Based Businesses:
- Consultants
- Freelancers
- Professional services firms
- Agencies with project-based work
B2B Companies with Longer Sales Cycles:
- Fewer opportunities, higher values
- Personal relationship focus
- Custom proposal processes
Businesses Requiring Heavy Customization:
- Unique data structures
- Specialized calculations
- Industry-specific requirements
When to Invest in Dedicated CRM
Consider upgrading from Excel when:
- Contact base exceeds 5,000
- Team grows beyond 15 people
- Need mobile sales team access
- Require marketing automation
- Email integration is critical
- Multiple departments need access
- Compliance demands strict audit trails
- Customer support ticketing needed
Conclusion
Microsoft Excel 2024 offers surprisingly robust CRM functionality for small businesses willing to invest modest time in setup. The five features coveredcontact management, sales pipeline tracking, automated calculations, business dashboards, and task management duplicate core CRM capabilities at a fraction of traditional CRM costs. For businesses with 1-15 employees, straightforward sales processes, and limited budgets, Excel-based CRM systems deliver professional customer relationship management without expensive monthly subscriptions.
The decision to buy Microsoft Excel 2024 as your CRM platform versus subscribing to dedicated CRM software ultimately depends on your specific business context. Excel excels (no pun intended) when customization, cost control, and familiar tools matter most. Dedicated CRMs win when scale, mobile access, and advanced automation become critical.
For many small businesses, starting with Excel makes perfect sense build your CRM system using features you already understand, prove the business value of structured customer management, and consider dedicated CRM platforms only when you’ve clearly outgrown Excel’s capabilities. This approach minimizes risk, controls costs, and ensures you’re solving actual business problems rather than paying for features you’ll never use.
If you need to buy Microsoft Excel 2024 to implement these CRM features, purchase from authorized Microsoft retailers or verified digital licence providers to ensure genuine software that activates successfully and receives ongoing security updates protecting both your investment and the critical customer data your business depends on.
FAQ – Excel for Business CRM
1. Can Microsoft Excel really be used as a CRM?
Yes. Microsoft Excel can work as a basic CRM tool for small businesses. It allows you to manage customer data, track leads, monitor sales pipelines, and generate reports using tables, formulas, and dashboards.
2. Is Excel a good alternative to expensive CRM software?
Excel is a cost-effective alternative for startups, freelancers, and small teams with simple sales processes. It eliminates monthly subscription costs while still offering data management, forecasting, and reporting features.
3. What are the main CRM features you can create in Excel?
You can build:
- Customer database management
- Sales pipeline tracking
- Revenue forecasting
- Task and follow-up tracking
- Performance dashboards
These features help businesses manage sales without investing in expensive CRM platforms.
4. How do you track sales leads in Excel?
Sales leads can be tracked by creating a structured spreadsheet with columns like lead name, contact details, source, deal stage, expected value, and follow-up date. Filters and conditional formatting help monitor progress efficiently.
5. What formulas are useful for CRM tasks in Excel?
Common formulas include:
- SUMIFS for revenue tracking
- COUNTIFS for lead conversion analysis
- IF formulas for deal status
- VLOOKUP or XLOOKUP for customer data retrieval
These formulas automate calculations and improve sales insights.
6. Can Excel create sales dashboards like CRM software?
Yes. Using pivot tables, charts, and slicers, Excel can create interactive sales dashboards. These dashboards help visualize KPIs, sales trends, and team performance similar to basic CRM analytics tools.
7. What are the limitations of using Excel as a CRM?
Excel lacks advanced automation, email integration, and real-time collaboration features found in dedicated CRM systems. As businesses grow, managing large datasets manually can become challenging.
8. Who should use Excel instead of a CRM system?
Excel is best for:
- Freelancers
- Small startups
- Local service businesses
- Businesses with low customer volume
It is ideal for companies that need simple and affordable sales management solutions.
10. Is Excel CRM suitable for long-term business growth?
Excel is a great starting point for managing customers and sales. However, growing businesses may eventually need advanced CRM software for scalability, automation, and better team collaboration.